My Projects
1. Student Statistical Consultant (Capstone Project)
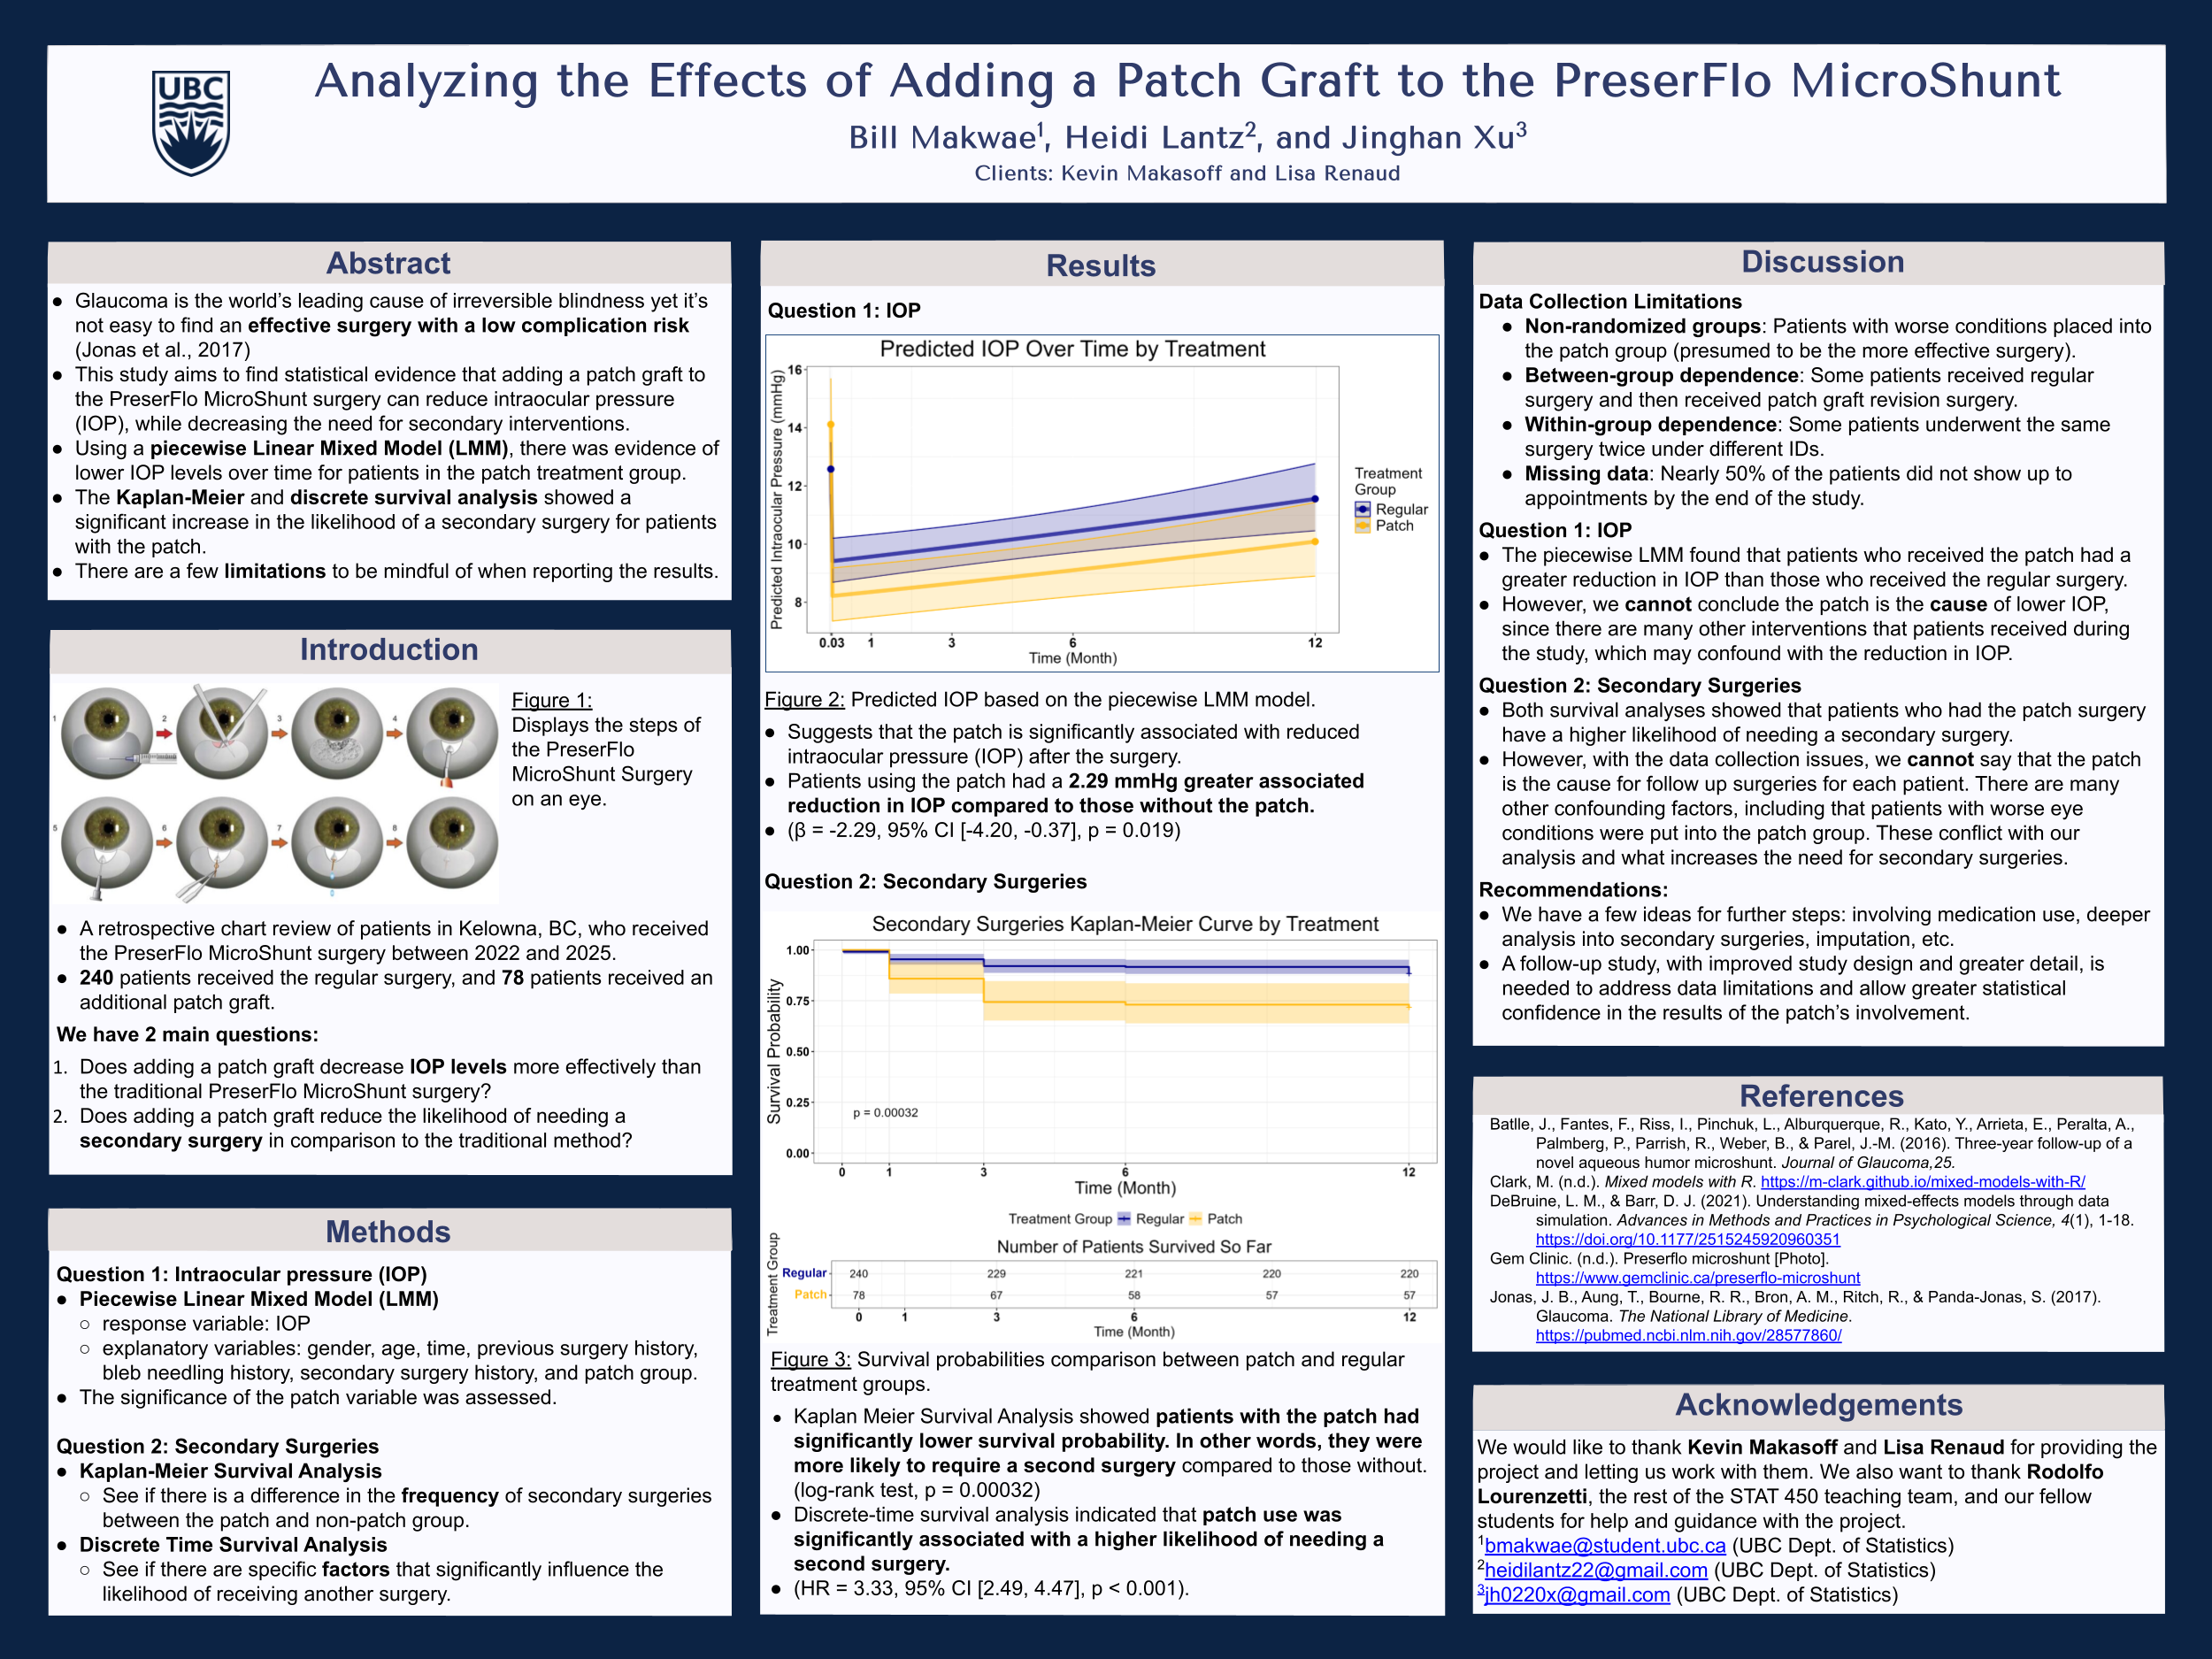
- With guidance from Dr. Rodolfo Lourenzutti, I worked for a client analyzing changes in glaucoma eye surgery in an apprentice type of job.
- Real client work, regular meetings with the professor presenting work, poster board and oral presentations
- Produced reports, code, and worked directly for the client using the R programming language and GitHub
- Learned about complications with study design, model selection, and effective statistical communication
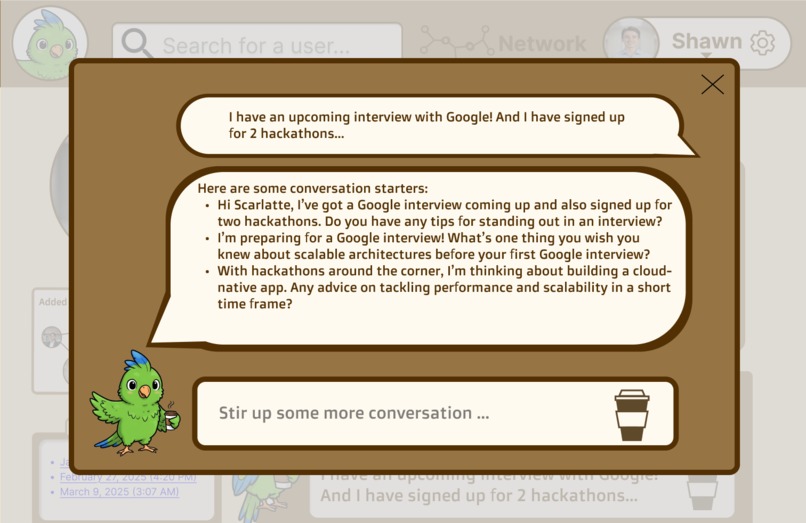
2. The Daily Grind (CMD-F Hackathon)
- A 24 hour Computer Science Hackathon on the weekend of March 8-9th, 2025
- Winners of the “Social Track” for our coffee-chat conversation starter using AI
- Won 3rd place overall, with 50+ projects and 200+ participants
- Presented work to 7 judges individually, and in the final round presented in front of the entire Hackathon community (over 250+ people).
- For more info, see our Devpost.
3. DSCI 310: Reproducible and Trustworthy Workflows
An analysis and package that is a fully reproducible and robust data analysis project, comprised of:
- A well documented and modularized software package and scripts written in R,
- A data analysis pipeline automated with GNU Make and Makefile’s,
- A reproducible report powered by R Markdown and Quarto,
- A containerized computational environment created and made shareable by Docker, and
- A remote version control repository on GitHub for project collaboration and sharing,
- As well as automation of test suite execution and documentation and software deployment.
For my group’s work, see the R package repository here and the analysis repository here.

4. Weather Extremes Research
- Working at UBC from May to August 2024 under an URSA NSERC scholarship
- Finding patterns and explanations for climate extremes. Dealt with Canadian weather data, relating to floods, droughts, and wildfires using Python and R languages. Completed EDA and used various statistical analyses to gain insight into weather patterns and time series analysis.
- Analyzed many research papers, presented work weekly, and assisted both professor Harry Joe and professor Natalia Nolde with various tasks.
- Work will be published on a public repository soon!
5. ASA DataFest
- A 48 hour Hackathon in a team of 3 for the American Statistical Association.
- Created a fully reproducible project, with EDA and a complex statistical analysis
- Created a dashboard, demonstration video, presentation using quarto, and analysis using a Bayesian model
- See the repository at: https://github.com/hlan22/asa_datafest_2025
6. wordplayr - An R Package
- The aim of
wordplayis to learn more about your favorite list of words! Learn about metrics such as length, most frequent starting letter, and much more with ease! - A fully functioning R package with clear
README.Rmdinstructions on how to install and use, along with a vignette, website, and Roxygen comments to help guide the user. - I have built up a ‘list of favorite words’ over the years and wanting to learn more about them is what inspired me to make this package!
- See the R package repository and the package website.

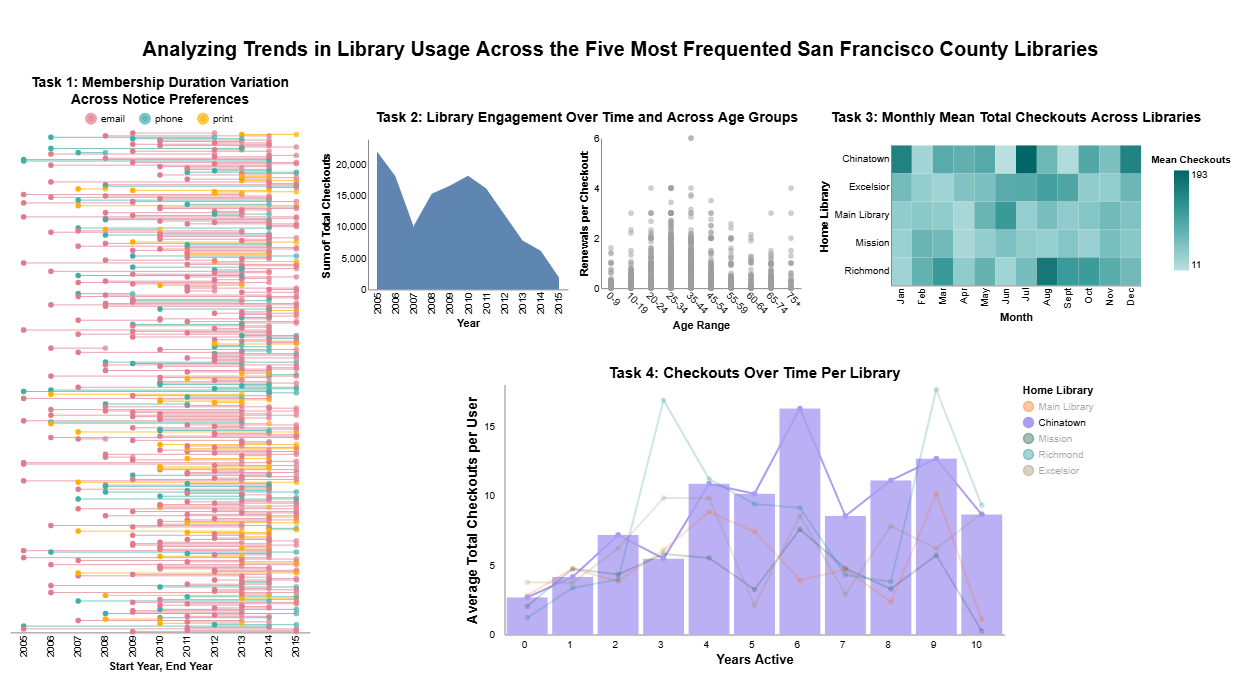
7. Python Dashboard & Data Visualization
DSCI 320 Dashboard
With two group members, we created the following dashboard where we had to create inventive visualizations to explain 4 questions. We looked into trends for attendance at libraries in the San Francisco area. The dashboard is interactive and has toggle options that don’t show up in the saved image.
8. easyEDA - A Python Package (In development)
- A Python Package (still in progress) such that you can “automate” EDA for any given dataset.
- Functions will quickly and easily create proper plots based on data types, for any and all columns.
- Code will be done with Python so that you can include interactive visuals, but will expand to R too.
- Link to the repository here