All projects listed were completed in 2024/2025 and were from a class project, hackathon, or just personal interest! Feel free to reach out on my LinkedIn if you want to learn more!
1. Statistical Research Consulting (Capstone Project)
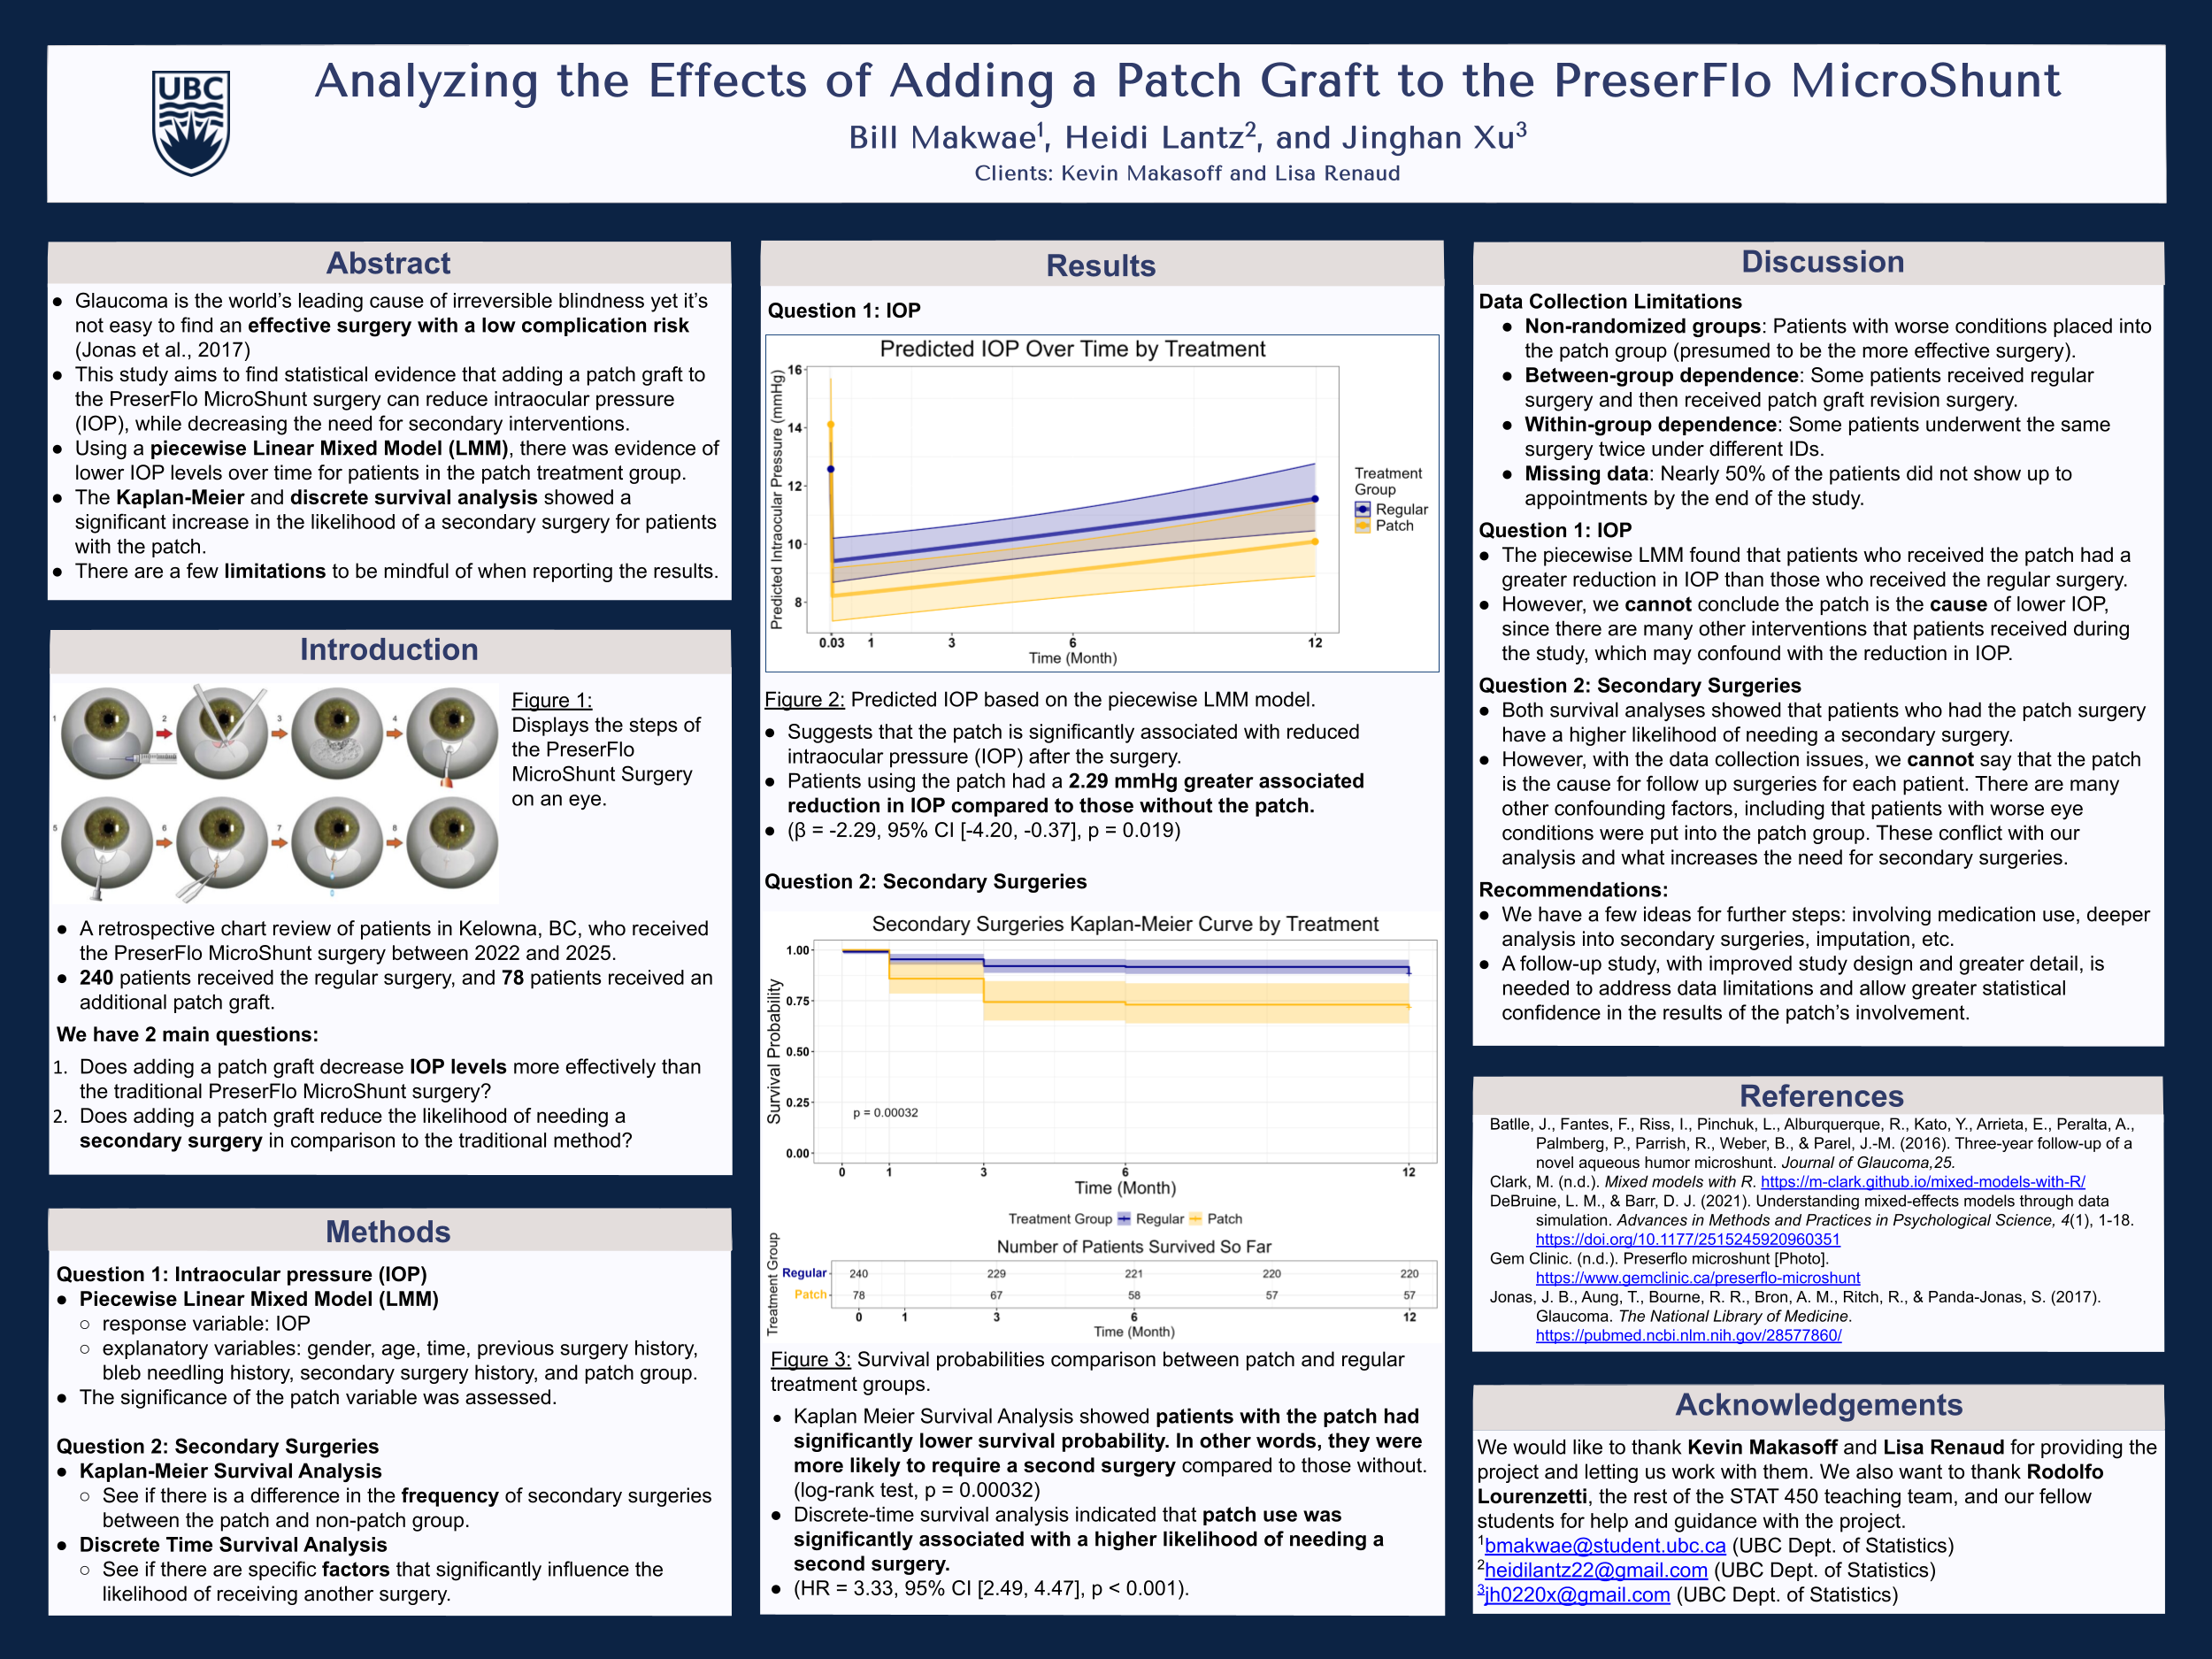
- Real consulting work for a client in medical research, analyzing changes and affects with glaucoma eye surgery
- Regularly presented work with professor Rodolfo Lourenzutti to ensure high-quality and reliable work was produced
- Met with client, presented findings at a poster board session, and did technical oral presentations to the STAT 450 class
- Produced written reports code repository, and visualizations using the R programming language and GitHub
- Learned extensively about complications with study design, model selection, and effective statistical communication
2. The Daily Grind (CMD-F Hackathon)
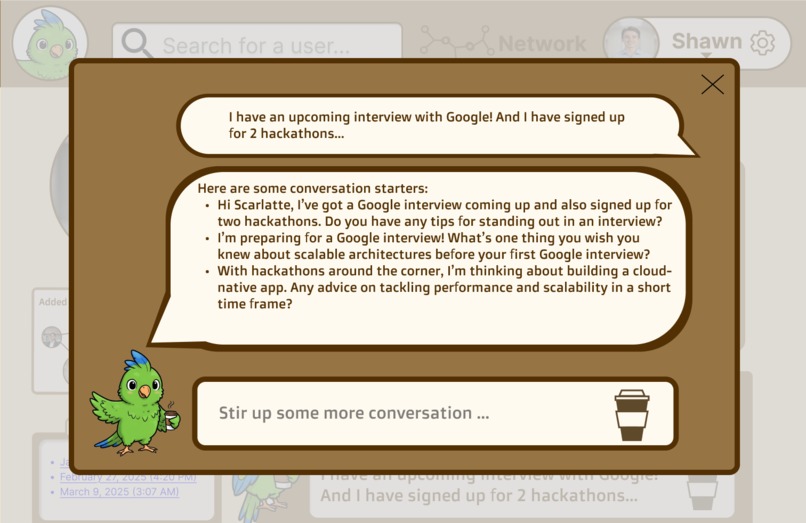
- A 24-hour computer science Hackathon in 2025 with 50+ projects and 200+ participants competing
- Our project was the Winner of the “Social Track” where we created a useful coffee-chat conversation starter
- Won 3rd place overall, after presenting to 7 judges and being invited to present in front of the entire Hackathon community (over 250+ people).
- For more information, please see the project on our Devpost.
3. Software Packages and Reproducible CI/CD Projects
In my DSCI 310 class (Reproducible and Trustworthy Workflows), we wanted to created both a data analysis project and a package that is a fully reproducible. This project promoted many sustainable data practices, including:
- A well documented and modularized software package and scripts written in R,
- A data analysis pipeline automated with GNU Make and Makefile’s,
- A reproducible report powered by R Markdown and Quarto,
- A containerized computational environment created and made shareable by Docker, and
- A remote version control repository on GitHub for project collaboration and sharing,
- As well as automation of test suite execution and documentation and software deployment.
For my group’s work, see the R package repository here and the analysis repository here.

4. Weather Extremes Research
- Working as a Research Assistant at UBC during Summer 2024 under an URSA NSERC scholarship.
- The goal was to find patterns and explanations for climate extremes. Regularly dealt with Canadian weather data relating to floods, droughts, and wildfires.
- Completed EDA and used various statistical analyses to gain insight into weather patterns and time series analysis.
- Using Python and R programming languages with RStudio IDE and Quarto for presentations.
- Analyzed many research papers, presented work weekly, and assisted both professor Harry Joe and professor Natalia Nolde with various tasks.
- I’m currently in the process of cleaning up the work to be published on a public repository!
5. DataFest Statistical Analysis Project
- A 48 hour Hackathon in a team of 3 for the American Statistical Association.
- Created a fully reproducible project with lots of EDA (Exploratory Data Analysis) and complex statistical analysis using a Bayesian model
- Produced a data dashboard, demonstration video, presentation slides using Quarto.
- See the repository here: https://github.com/hlan22/asa_datafest_2025
6. Custom Python Dashboard
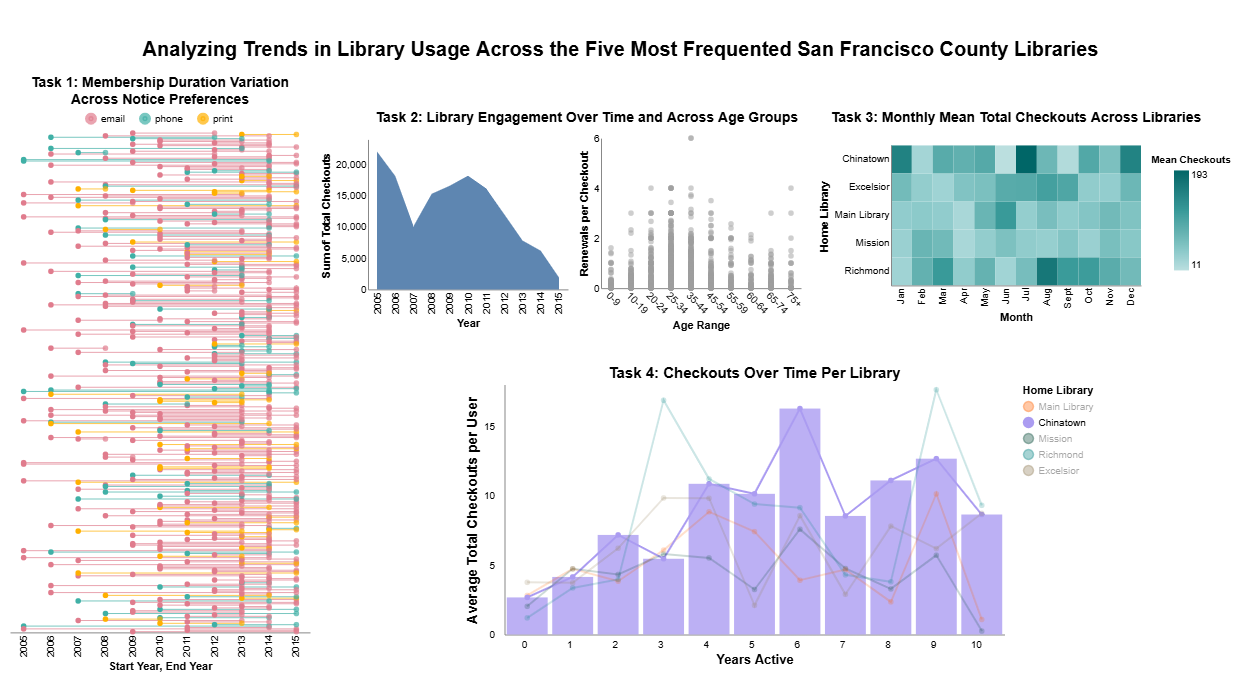
DSCI 320 Dashboard
With the help of two group members, we created the following dashboard where we looked into trends for attendance at libraries in the San Francisco area. We had the requirement to create inventive visualizations to explain 4 questions. The dashboard is fully interactive and has toggle options (not shown in image below).
7. wordplayr - An R Package
- The aim of
wordplayris to gain insights and discover patterns about your favorite list of words! Learn about metrics such as average word length, most common starting letters, frequent vowel sounds used in your words, and much more with ease! - A fully functioning R package with clear
README.Rmdinstructions on how to install and use, along with a vignette, package website, and Roxygen comments to help guide the user. - I built a list of my favorite words over the past few years, and I really wanted to learn more about why I like those words and if I could see any common patterns with them. This is what inspired me to make this package! If you’re curious, my favorite words most frequently start with the letter ‘C’!
- See the R package repository and the package website.

8. easyEDA - A Python Package
- A Python Package (currently in progress) that helps automate EDA for any given dataset.
- Functions will quickly and easily create proper plots based on data types, for any and all columns.
- Allows for easy and relaxed exploration of a dataset, but also allows for complex analysis and presentation-ready visualizations.
- Coded with Python with implementation for interactive visuals, but will eventually expand to an R package as well.
- Link to the repository here