Plot the most common words in a column of a dataframe.
top_words_plot.RdPlot the most common words in a column of a dataframe.
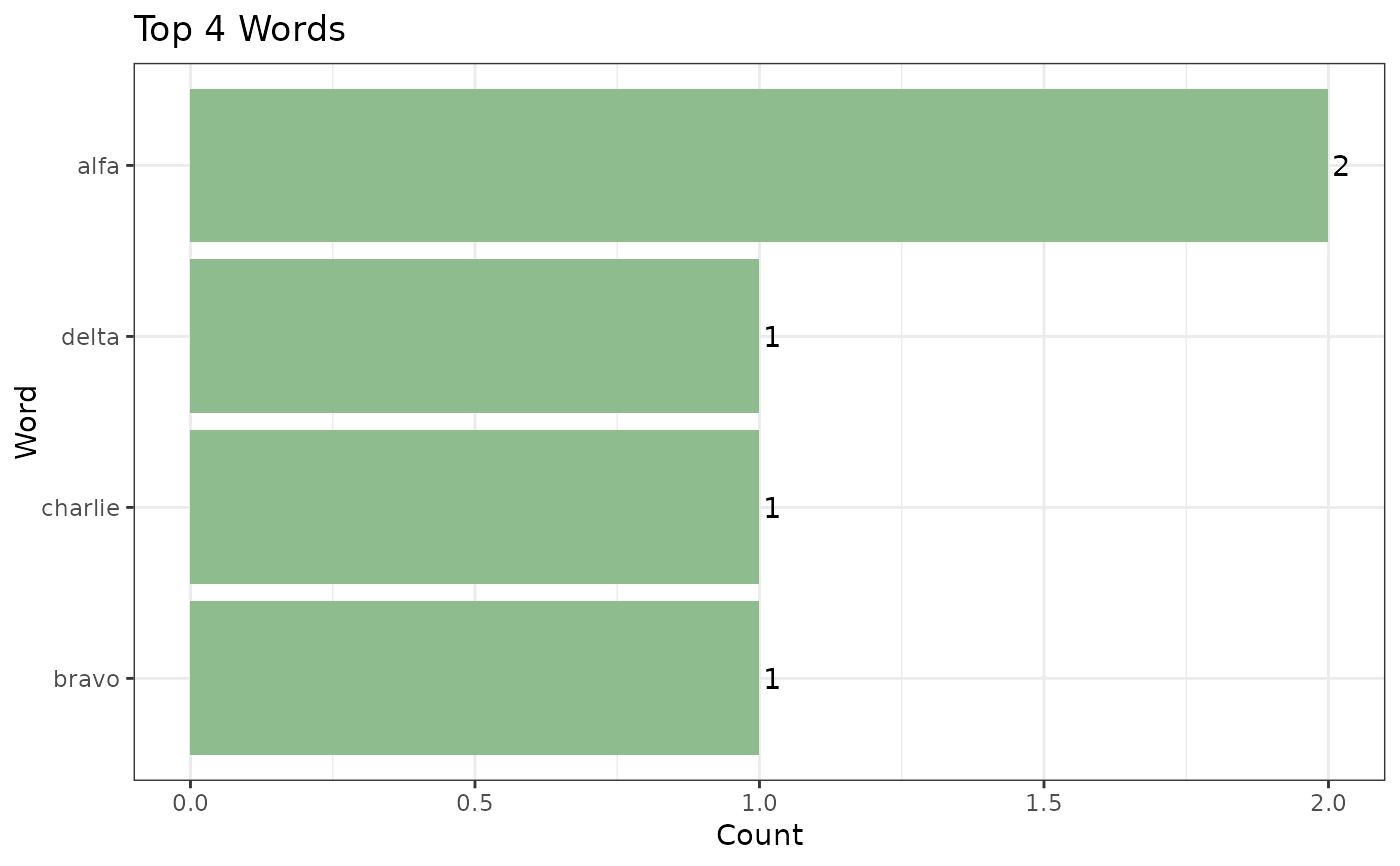
Examples
example_words <- data.frame(word_column = c("alfa", "bravo", "charlie", "delta", "alfa"))
top_words_plot(example_words, column = "word_column", top_n = 4)